
How to Look Up Lubbock County Jail Population Data
The main source for county jail counts in Texas is the state. The Texas Commission on Jail Standards County Population Reports page posts monthly figures for every county jail. Each county files a report. The state then publishes a roll-up. For Lubbock County, this is the official place to find the current jail count and the rated capacity for the detention center. The reports update monthly, so the numbers shift through the year.
The TCJS report is a snapshot. It shows total inmates on a set reporting date, not a live count. The figures are official, but they age fast as people get booked and released. For population size context, the county's own data sits at the Census QuickFacts for Lubbock County page. Census numbers are the base used to judge whether a jail count is large or small for the area. Both sources are public and free to read.
The state report page lists each county and links the monthly population files.
Pull the most recent monthly PDF from the TCJS reports index to see the latest Lubbock County jail count and the rated capacity in the same row.
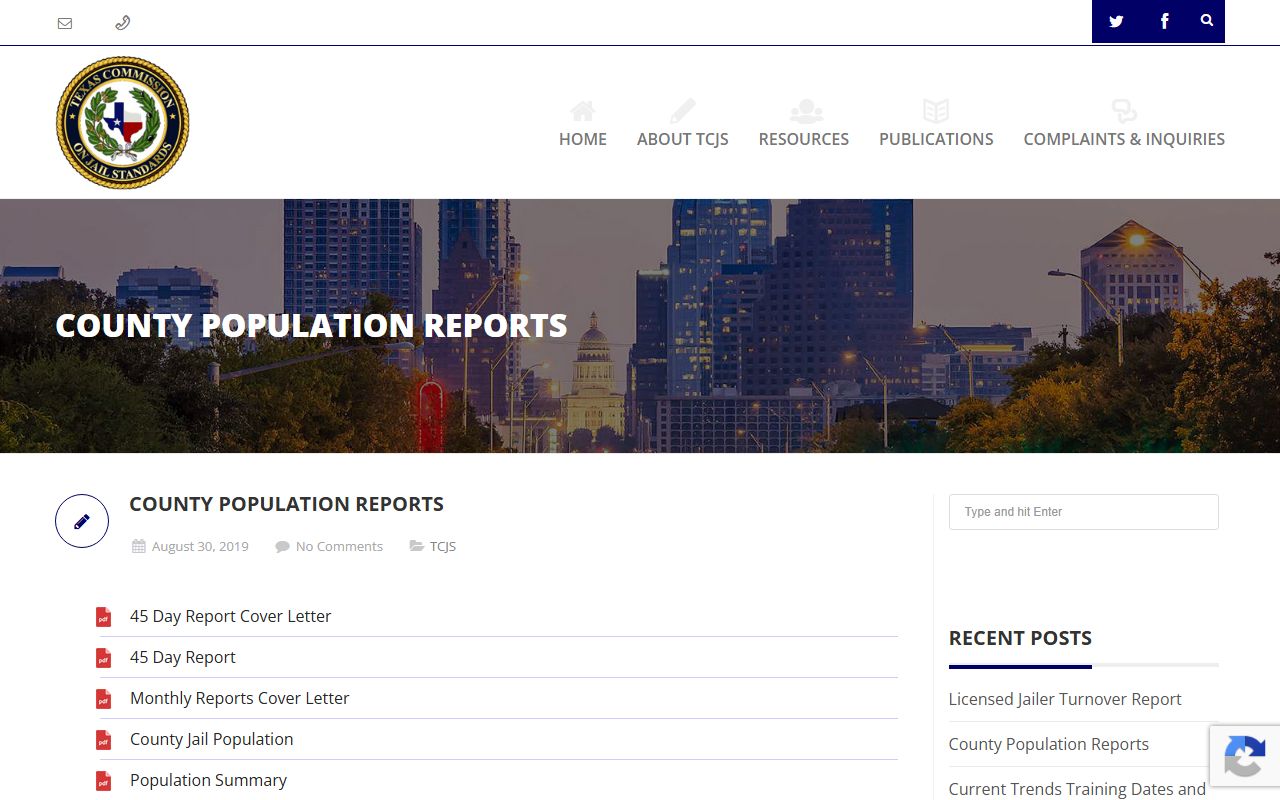
That state index is where the Lubbock County jail population is reported each month, alongside capacity and transfer categories the county must file.
Lubbock County Jail Capacity Overview
Booked inmates in Lubbock County are held at the Lubbock County Detention Center on North Holly Avenue. The Lubbock County Sheriff's Office runs it. The detention center is the single local jail facility for the county. Official county and sheriff pages name the facility and give its address, but they do not state a rated bed capacity in the text reviewed. So the bed count is not published in those county pages.
For the rated capacity, the right source is the latest monthly TCJS report. That state file lists the jail's rated capacity next to the current count. The table below shows what is and is not published in the county's own material.
| Facility | Rated Capacity | Current Population |
|---|---|---|
| Lubbock County Detention Center | Not published in county text; see latest TCJS monthly report | Reported monthly by TCJS |
When a Texas county jail runs over its total capacity for three months in a row, the state can step in. TCJS may consider action under state law in that case.
Note: The detention center's rated capacity is not listed on the official county or sheriff pages, so the latest TCJS monthly PDF is the source to use for that figure.
Average Daily Population in Lubbock County
Average daily population, or ADP, smooths out the daily swings. It takes the count across a period and finds the typical number held each day. Official Lubbock County budget and financial snippets list three ADP values for recent periods. The figures are 1,256, then 1,284, then 1,378. These are county-reported averages for the detention center, not live counts.
The trend points up. Each listed period is higher than the one before. The table below sets the three figures side by side so the rise is easy to read.
| Reporting Period | Average Daily Jail Population |
|---|---|
| Earlier period | 1,256 |
| Middle period | 1,284 |
| Most recent period | 1,378 |
These three numbers are county-specific. They come from Lubbock County's own budget and financial material, not from a state or national average. A rise of this size matters for staffing, beds, and county cost.
Lubbock County Demographic Context
A jail population is not the same as the county population. The county's resident demographics give context, but they do not describe who is in the jail. Census QuickFacts reports these figures for Lubbock County residents. They are county-wide numbers. They are not a breakdown of the people held at the detention center.
| County Resident Group | Share of County Population |
|---|---|
| Under age 18 | 23.3% |
| Age 65 and over | 13.7% |
| Female | 50.7% |
| Hispanic or Latino | 37.1% |
| Veterans (2020-2024) | 12,189 residents |
To be clear, the figures above describe Lubbock County residents as a whole. A jail-specific demographic breakdown by age, race, or sex for the detention center was not located in official county text. So a true jail demographic split cannot be shown here without inventing numbers, and that will not be done.
The Census page holds the full county profile used for this context.
Open the Census QuickFacts for Lubbock County to confirm each resident figure and to see the full demographic table for the county.
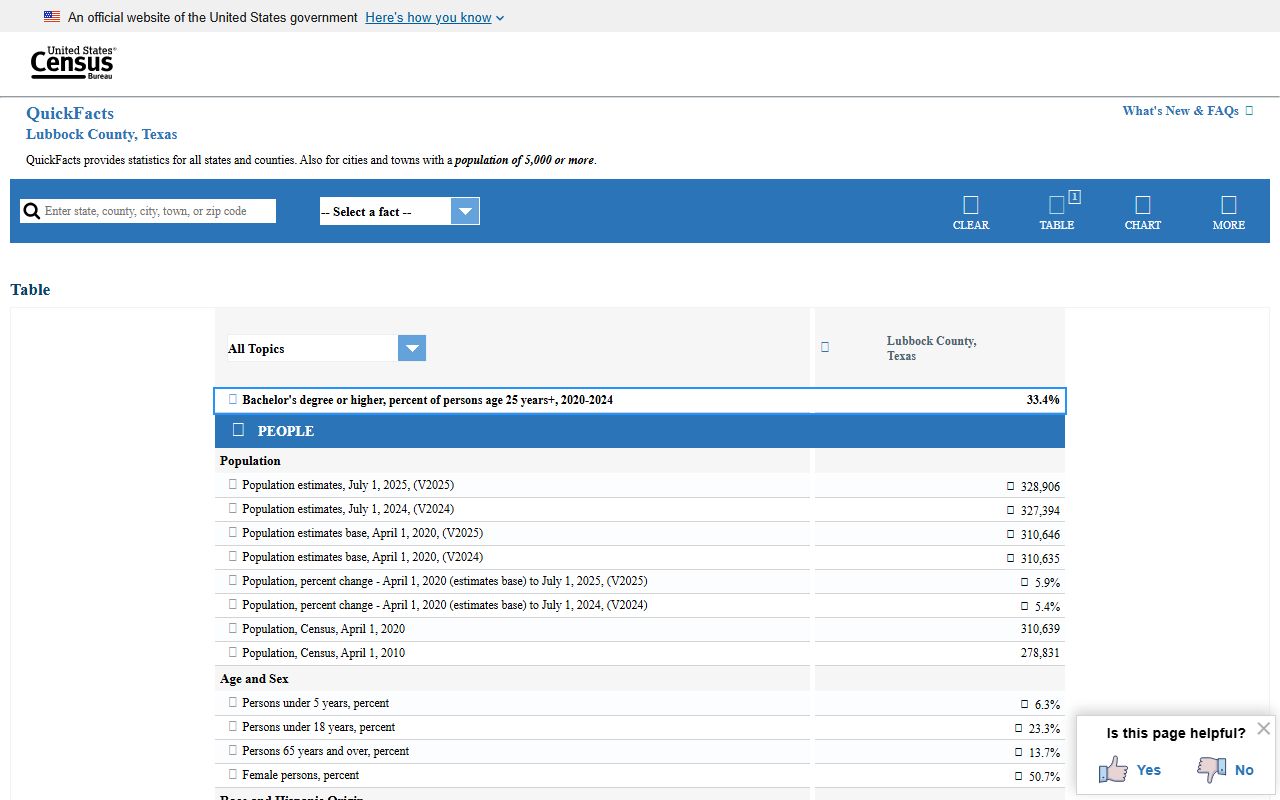
That Census profile is the base used to weigh the Lubbock County jail population against the size and makeup of the county as a whole.
Pretrial vs. Sentenced Population
Jail counts often split into two big groups. One group waits for trial. The other is serving a sentence or held on a hold. Many Texas county jails hold a large share of pretrial inmates, people who have not been convicted yet. That split shapes how a jail is run and what it costs.
For Lubbock County, the exact pretrial vs. sentenced ratio was not located in official county text. This is a research gap. No local percentage is published in the county material reviewed, so no split is shown here. The monthly TCJS report does carry related categories, such as inmates awaiting transfer to state prison, which a reader can pull from the latest file.
Misdemeanor vs. Felony Population
Charge level is another way to read a jail count. Felony cases route through the district courts. Misdemeanor cases route through the county courts at law. The mix of felony and misdemeanor inmates affects how long people stay and where their cases go.
A misdemeanor vs. felony breakdown for the Lubbock County Detention Center was not located in official county text. This is a research gap. No local figure is published in the county data reviewed, so none is shown. To trace a single case by charge, use Lubbock County court records or the arrest records page instead.
Mental Health and Medical Population
Many jails track how many people in custody need mental health or medical care. These counts help plan staffing and services. They also affect housing choices inside the facility.
For Lubbock County, a mental health or medical population breakdown was not located in official county text. The cost per inmate per day was not located either. Both are research gaps. No local figures are shown here because none were published in the county material reviewed. The detention center does run inmate programs, but those pages do not give a medical or mental health count.
Lubbock County Jail Data in Context
Raw jail counts read better with a denominator. Lubbock County had 310,639 residents in the 2020 Census and an estimated 328,906 in 2025. That is county-specific data from the Census. Set against an ADP near 1,378, the jail holds a small fraction of the county at any one time, which is normal for a county jail.
The Bureau of Justice Statistics publishes national jail data, and the Texas Commission on Jail Standards publishes the Texas figures. A direct per-100,000 rate for Lubbock County versus the state and the nation was not pulled into the county material reviewed, so an exact rate comparison is not shown here. What can be shown is which figures are local and which are state or national in scope.
| Figure | Value | Scope |
|---|---|---|
| Detention center ADP (recent) | 1,378 | County-specific |
| County population (2020 Census) | 310,639 | County-specific |
| County population (2025 estimate) | 328,906 | County-specific |
| National jail rate per 100,000 | See BJS national jail data | National |
| Texas county jail counts | See TCJS monthly reports | State |
So the ADP and the county population are local. The national rate is a BJS figure, and the statewide counts come from TCJS. Keeping the source clear keeps the comparison honest.
Lubbock County Jail Population Trends
Two trends move together here. The jail's average daily population rose across the three listed periods, from 1,256 to 1,284 to 1,378. The county population also grew, from 310,639 in 2020 to an estimated 328,906 in 2025. That is a 5.9 percent rise from the 2020 base.
Population growth is only part of the story. A jail count also reflects court backlogs, charging patterns, bond and pretrial release practices, and transfers to state or federal custody. A rise in the jail count does not always mean more crime. It can mean cases move slower, or that more people are held before trial. Read the ADP trend with those drivers in mind, not as a single cause.
The earliest Census mark for context is 278,831 residents in 2010. The county has grown each decade since.
Searching for Lubbock County Inmate Records by Name
This page covers aggregate Lubbock County jail population data, not single-person lookups. To find one person in custody by name, booking number, or SO number, use the live jail roster through the Lubbock County inmate records page instead.
Where the Lubbock County Jail Data Comes From
The numbers on this page trace to a short list of official sources. State law sets the reporting rule. Texas Government Code Section 511.0101 requires each county to report its jail population to the Texas Commission on Jail Standards. Those reports include categories such as rated capacity, total inmates, local inmates housed elsewhere, and prisoners awaiting transfer to state prison.
The core sources used here are listed below, with what each one provides.
- TCJS County Population Reports - monthly jail counts and rated capacity for the Lubbock County Detention Center.
- Lubbock County budget and financial files - the ADP figures of 1,256, 1,284, and 1,378.
- Census QuickFacts - county population and resident demographics.
- Bureau of Justice Statistics - national jail data used for broad context.
Several breakdowns are gaps, as noted above. Demographic, pretrial, charge-level, and medical splits for the jail were not in the official county text reviewed. When a figure is missing here, it is because it was not published in those sources, not because it was left out.